Don't Just Focus on Trading Volume: A Guide to Understanding the "Fake Real Volume" of Perpetual Contracts


Original Article Title: Reading Perps Beyond Volume
Original Article Author: Prathik Desai, Token Dispatch
Original Article Translation: Bitpush News
Just when you think finance is becoming dull, it always finds a way to surprise you. Lately, it seems like everyone is restructuring the financial system in ways no one could have anticipated, even those from the entertainment and media industries.
Take Jimmy Donaldson, for example, who not only has a snack empire but also recently acquired a banking app aimed at promoting financial literacy and money management to teenagers and young adults. Why? Perhaps nothing is more direct than leveraging financial products to monetize a user base of 466 million subscribers.
This summer, the world's largest derivatives exchange, CME Group, will introduce single-stock futures, allowing users to trade futures of over 50 top US stocks, including Alphabet, NVIDIA, Tesla, and Meta.
These restructurings have shown us how people are changing the way they engage with finance. And in recent years, few things demonstrate this as clearly as the explosion of the Perpetual Markets.
Perpetual Futures (or Perps) are a type of financial derivative contract that allows market participants to speculate on asset prices without an expiry date. Perps also enable people to express their views on assets quickly and cheaply. They are more appealing than traditional markets because they offer instant access and leverage. Unlike traditional markets, they do not require a broker onboarding process, have no jurisdictional paperwork, and do not adhere to "traditional" market hours.
Furthermore, on-chain perpetual markets allow trading of any asset (whether traditional or crypto) in a permissionless, high-leverage manner. This makes speculation exciting, especially when humans cannot resist gambling on the trajectory of volatile assets outside traditional trading hours. This allows risk to be priced in real-time.
Consider what happened two weeks ago. When both traditional and crypto markets crashed simultaneously, traders flocked to Hyperliquid, driving perpetual gold and silver trading into a frenzy. On January 31st, solely on Hyperliquid's silver perpetual contract market, which had been launched less than a month prior, accounted for 2% of the global daily silver trading volume.
This explains why the perpetual contract trading volume dashboard is increasingly dominating the crypto community and forums. Volume is an absolute value. It looks significant, refreshing every few minutes, which is perfect for rankings. However, it misses a key subtle difference: the volume may reflect a meaningless type of movement. A market with high volume may be due to sufficient liquidity depth, but it could also be because rewards and incentive mechanisms encourage higher-frequency activity. This type of activity is often recursive and lacks meaning.
This week, I delved into other indicators of the perpetual trading market. When these indicators are used in conjunction with volume, they add more dimensions and tell a completely different story from just volume.
Let's get started.
Several Data Points
The perpetual market's user-friendly interface has made it a low-barrier, default interface for expressing views across various markets and global assets. The wide selection of high-leverage derivative trading for both traditional and crypto assets on a single platform has led to perpetual contract trading volume surpassing spot trading volume on decentralized trading platforms. From 44% in February 2025, the perpetual contract volume has soared to around 75% today (relative to spot trading volume).
This growth has been particularly significant in the past few months:
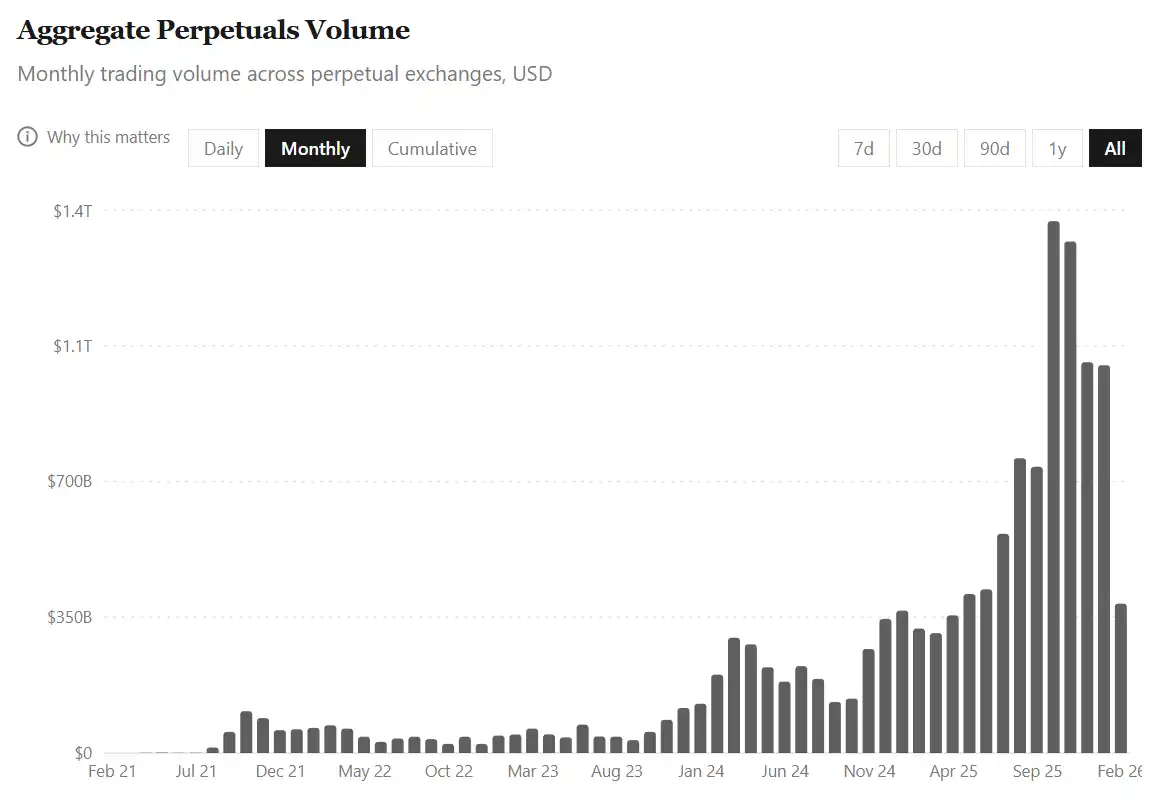
· Over the four years ending July 31, 2025, the total cumulative perpetual trading volume across all platforms was $6.91 trillion.
· In just the past six months, this volume has doubled to reach $14 trillion.
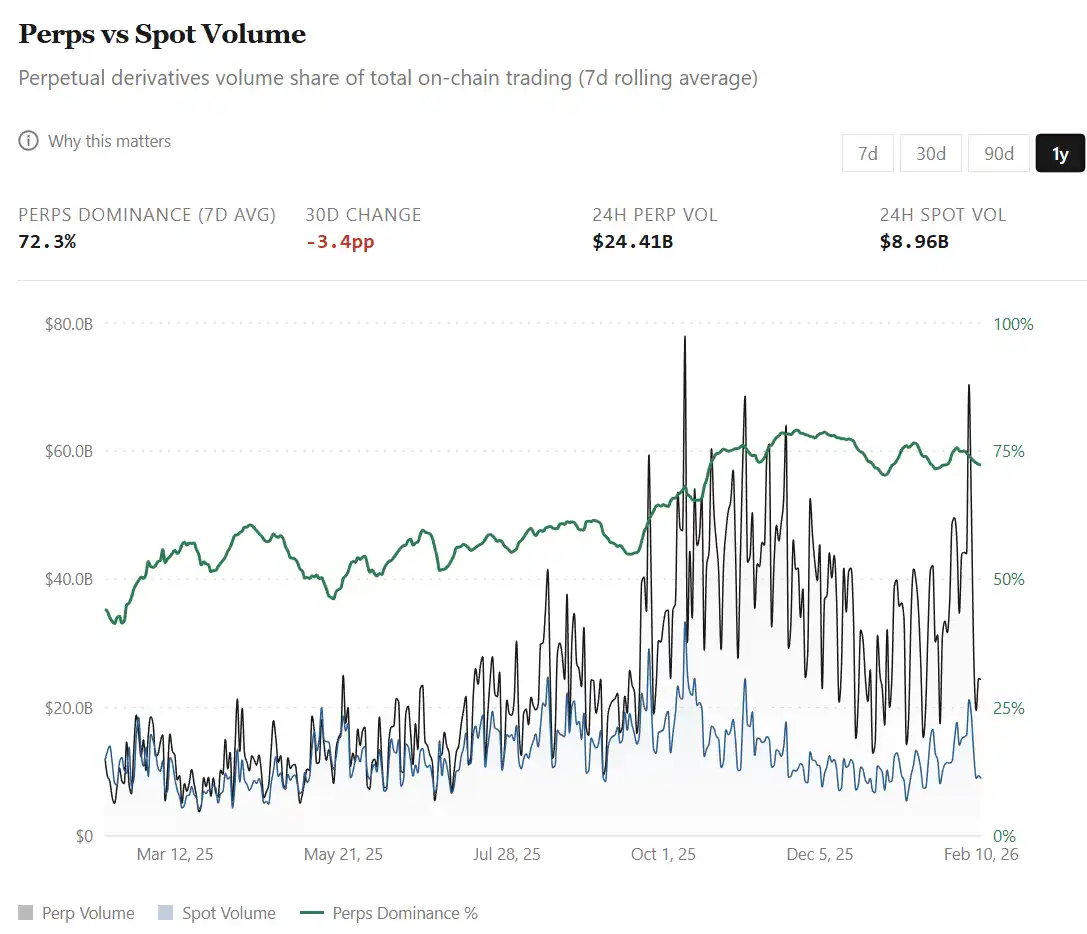
All this growth has occurred against the backdrop of a nearly 40% shrinkage in total cryptocurrency market capitalization from August 1, 2025, to February 9, 2026. This level of activity indicates that traders are increasingly leaning towards derivative trading, hedging, and short-term positioning, especially when the spot market becomes highly volatile and bearish.
But there's a catch here. In such massive activity, the volume indicator can be easily misread. Particularly because perpetual trading is not just about buying an asset and holding it long term; it also involves leveraging to adjust bet sizes repeatedly within shorter time frames.
Therefore, when market turnover rate rapidly increases, inevitably, a question comes to mind: Does the record-breaking volume reflect more capital inflow, or is the same capital cycling at a faster pace?
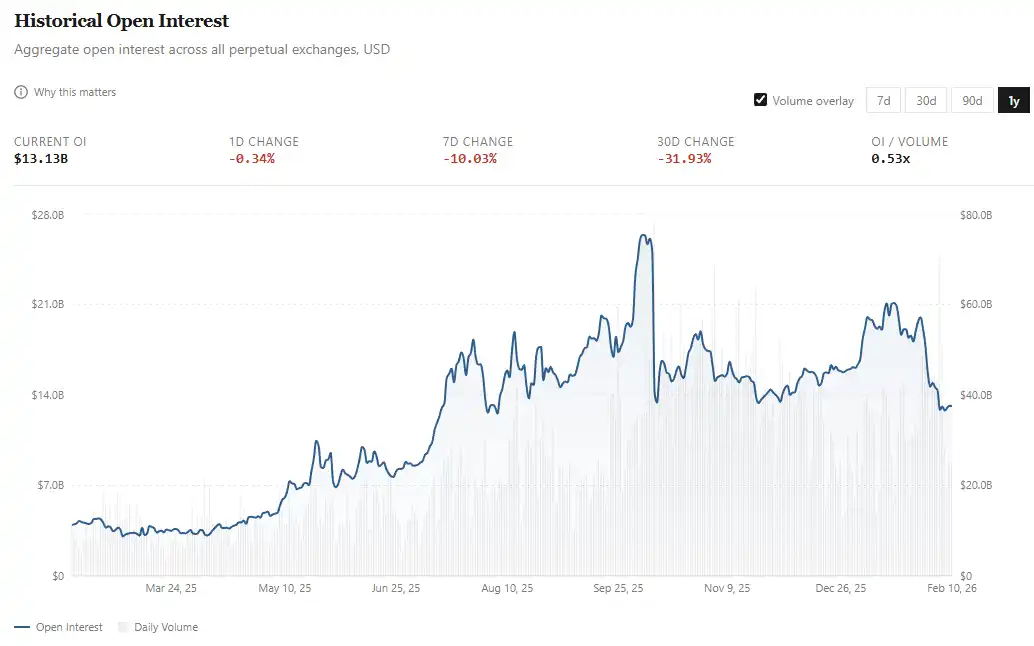
This is the significance of Open Interest (OI) observation. If trading volume reflects capital flow, then OI measures the unrealized risk exposure. On perpetual trading platforms, OI refers to the total dollar value of active, unsettled long and short contracts held by traders.
If perpetual trading is embraced by the mainstream market, we not only hope to see increased capital flow but also proportionate growth in open interest.
· In February of last year, the average OI was about $4 billion;
· Now, this number has more than tripled, reaching around $13 billion. In fact, the January average once hit about $18 billion and then dipped by around 30% in the first week of February.
Although perpetual trading volume has doubled in the past five months, OI has grown by about 50% (from $13 billion to around $18 billion, then fell back to $13 billion). To better understand this, I observed capital efficiency (i.e., the percentage of OI to daily trading volume) trend over the past year.
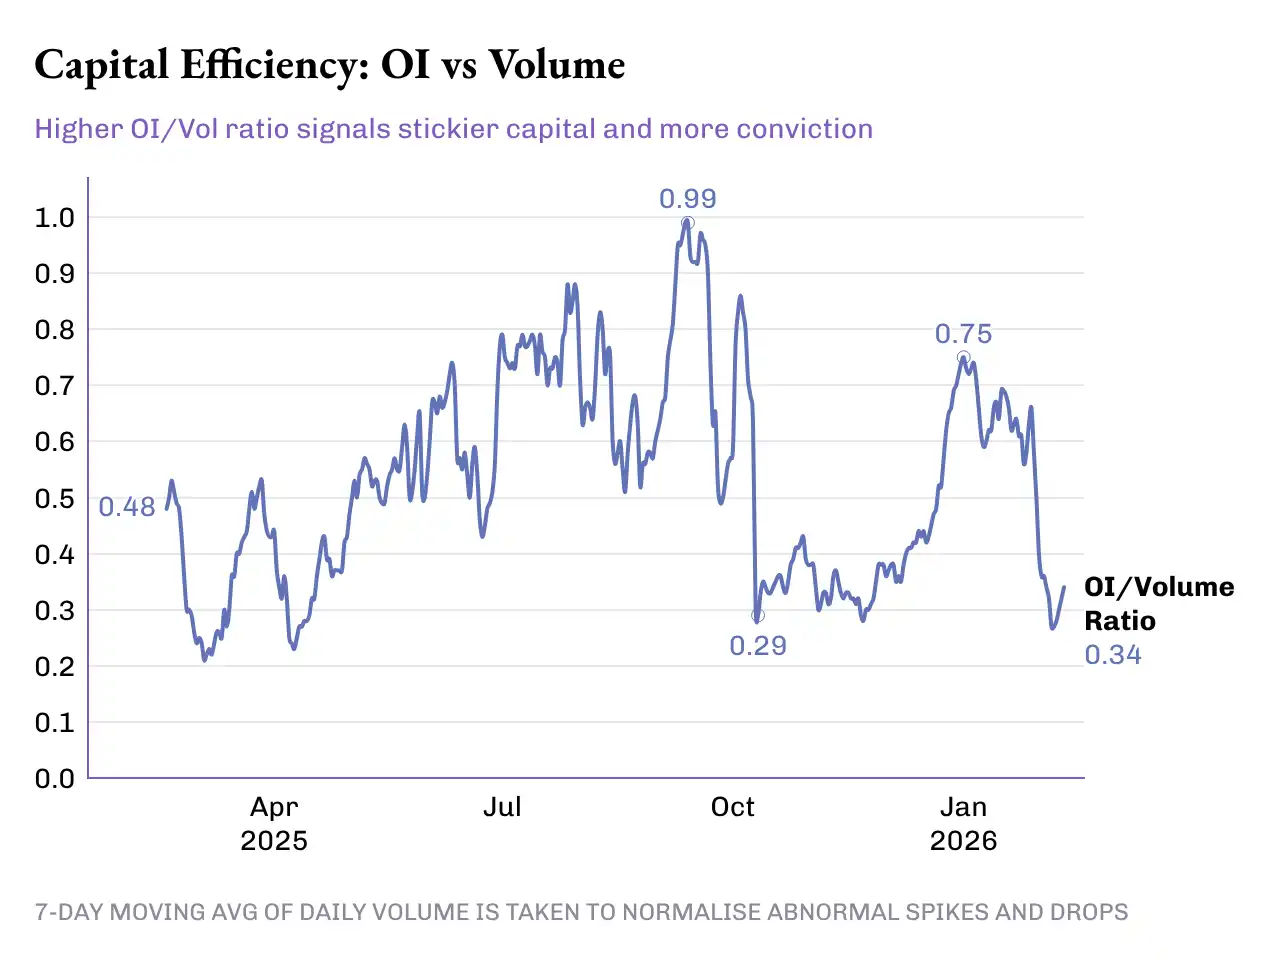
The OI/trading volume ratio has jumped 50% from last year's 0.33x to today's 0.49x. However, this progress was not smooth-sailing, experiencing multiple peaks and valleys during the 50 basis points increase in the ratio:
· Phase One (February-May 2025): Pensive period. The OI/trading volume ratio averaged around 0.46x, with an average OI of around $4.8 billion and an average daily trading volume of around $11.5 billion.
· Phase Two (June-Mid-October): Leap period. The ratio averaged around 0.72x. During this period, the average OI rose to $14.8 billion, with a daily trading volume of $23 billion. This not only marked a historic high in trading volume but also signaled increased risk exposure and greater capital allocation to these derivatives.
· Phase Three: Market reversal. This phase began with a massive liquidation on October 10, wiping out over $19 billion in leveraged positions within 24 hours. From mid-October to late December, the OI/trading volume ratio dropped to ~0.38x, primarily driven by trading volume growth while open interest remained mostly stagnant. October, November, and December saw the highest three-month trading volumes of 2025, averaging over $12 trillion each month. Meanwhile, OI averaged around $15 billion, slightly lower than the previous three months' average.
Protocol Layer
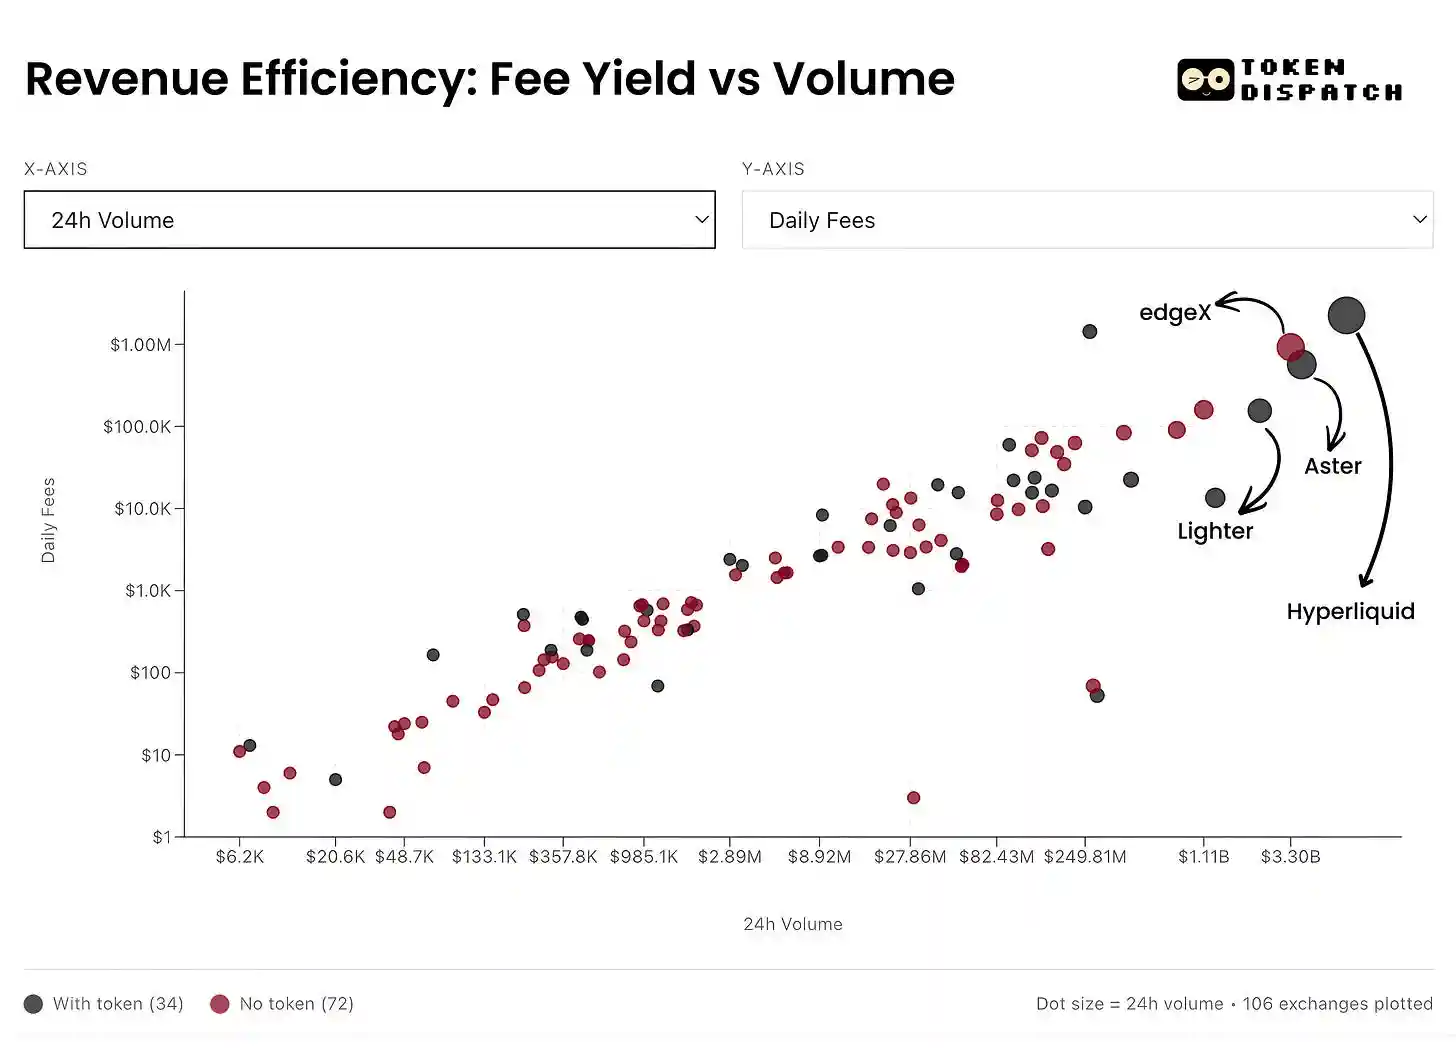
Here, I aim to add more dimensions to the perpetual market at the protocol layer. This helps us understand how perpetual trading platforms convert trading activity into "sticky capital" and the efficiency of revenue generation.
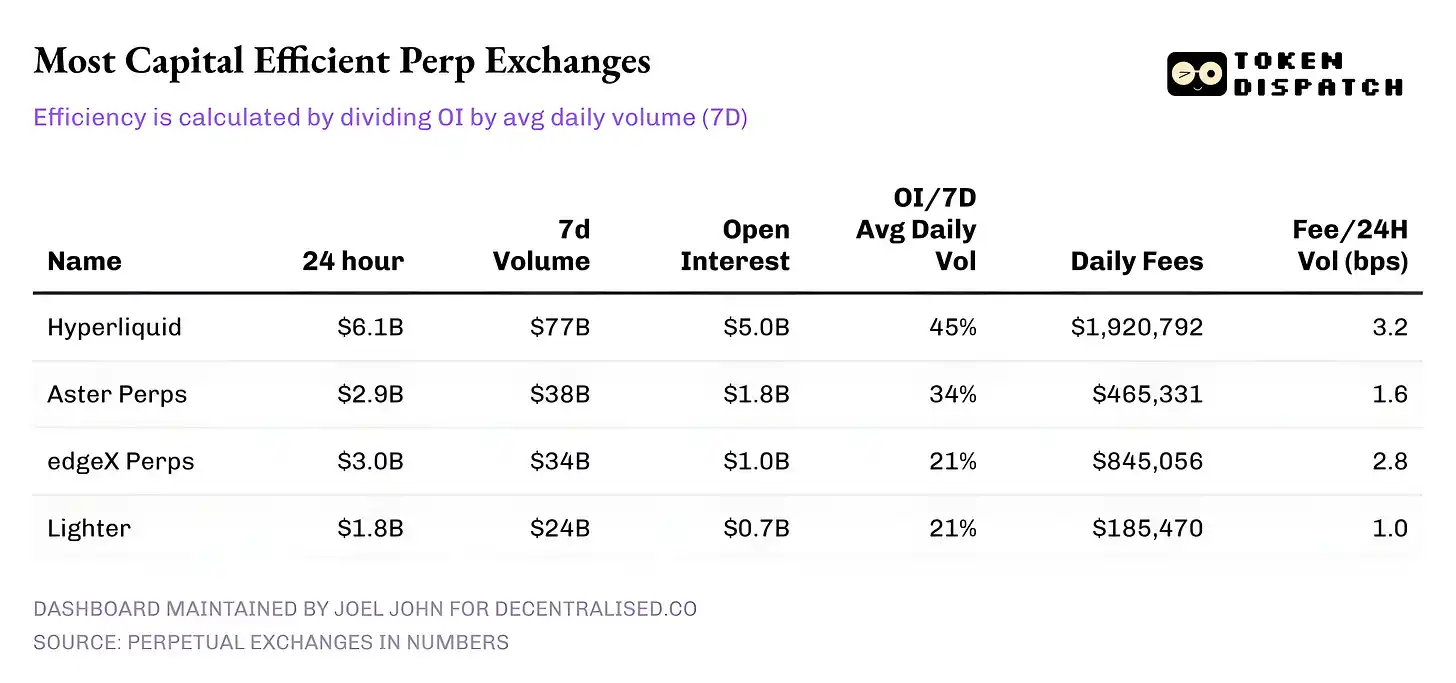
As of February 10, here are the top five perpetual trading platforms based on 24-hour trading volume:
· Hyperliquid: With an OI to 7-day average daily volume ratio of over 45%, it can convert a significant portion of its trading volume into open interest. This indicates that for every $10 traded on the platform, $4.5 is allocated to active positions. This is crucial because a high OI ratio leads to tighter spreads, deeper liquidity, and confidence to scale trades without slippage.
· Hyperliquid's fee revenue further emphasizes this narrative. Its take rate is approximately 3.2 basis points, effectively converting the majority of its 24-hour trading volume into fee revenue.
· Aster: Currently ranked second, despite having nearly half the volume of Hyperliquid, still boasts a decent 34% capital efficiency (OI/Vol). However, its fee realization is notable — with a lower take rate (around 1.6 bps), Aster seemingly prioritizes capital retention on its platform over fee maximization.
· edgeX and Lighter: Both demonstrate similar capital efficiency metrics, with OI/Vol at 21%. However, edgeX matches Hyperliquid in fee realization, at 2.8 bps.
Summary
An interesting observation is that the perpetual contract market today is no longer a simple growth story; it requires nuanced readings across multiple metrics. On a macro level, trading volume has seen explosive growth: the total cumulative perpetual trading volume over six months has exceeded the sum of the previous four years. However, the picture only becomes clear when OI and volume are read together.
A more explicit victory lies in the growth of the OI/Volume ratio. This is a direct signal that "patient capital" is willing to trust and bet on the various products and markets appearing on perpetual trading platforms.
What is more worth observing in the future is how individual players will evolve from here and what they choose to optimize. Over time, platforms that can optimize "trading conviction" and achieve sustainable fee realization will be far more critical than those merely dominating the volume charts through rewards and incentivization.
You may also like

The arrival of the Web 3.0 era: A review of Hong Kong court rulings on digital assets

Track Markets At a Glance: New WEEX Price Widgets for iOS & Android
To streamline your market data access, WEEX has officially launched "Market Watchlist" desktop widgets

The billion-dollar lesson: The focus of DeFi security is shifting from code to operational governance

A Brief Analysis of Stablecoin Licenses and On-Chain Funding
BVNK Founder: Three Stages of Stablecoin Development

The truth about Trump's son's Bitcoin game: he made a staggering $100 million while retail investors lost $500 million

What Is Futures Trading? Hours, Platforms, and How to Start Trade Futures(2026 Guide)
Learn how to start futures trading, understand trading hours, and choose the best futures trading platform. Includes real data, strategies, and ways to maximize returns with rebates.

The Rise of Composable RWA

MAGA Up 350% in 24 Hours, PEPE Up 46% in One Day: Which Memecoins Are Next in 2026?
MAGA +350% in 24hrs. PEPE +46% in one day. RAVE +4,500% then -90%. In 2026's memecoin market, the gains are real. So are the traps? Here's how to tell the difference before you buy.

RCD Espanyol vs Real Madrid: Can the Pericos Delay the Inevitable?
RCD Espanyol vs Real Madrid lineups, standings, and stats for May 3, 2026. Real Madrid visits RCDE Stadium as Barcelona closes in on the LALIGA title. Full preview inside.
MegaETH goes live with an FDV exceeding 2 billion USD. Which ecological projects are worth paying attention to?

Dialogue with "Wood Sister" Cathie Wood: The next bull market is about to arrive
Can prediction markets win the competition for perpetual contracts?

Who is trading on Trade.xyz?

Binance quietly placed a bet on a leading large model company

Best Crypto Discord Server 2026: Why Jacob’s Crypto Clan Is Gaining Massive Attention
Jacob’s Crypto Clan has grown into one of the most active crypto Discord communities, with over 45K members and continuing to expand. This rapid growth reflects strong demand for structured trading insights and real-time collaboration.

Tom Lee Buying ETH: Why Wall Street’s Loudest Ethereum Bull Keeps Doubling Down
Tom Lee keeps buying ETH through every dip, every drawdown, and every moment of market doubt. Inside the strategy that's turning Ethereum into a treasury asset — and what it signals for the rest of the market.

Stripe Sessions 2026: AI Agent, Global Payments, and Invisible Crypto Infrastructure
The arrival of the Web 3.0 era: A review of Hong Kong court rulings on digital assets
Track Markets At a Glance: New WEEX Price Widgets for iOS & Android
To streamline your market data access, WEEX has officially launched "Market Watchlist" desktop widgets
